My Work > My Workspace has 2 sections:
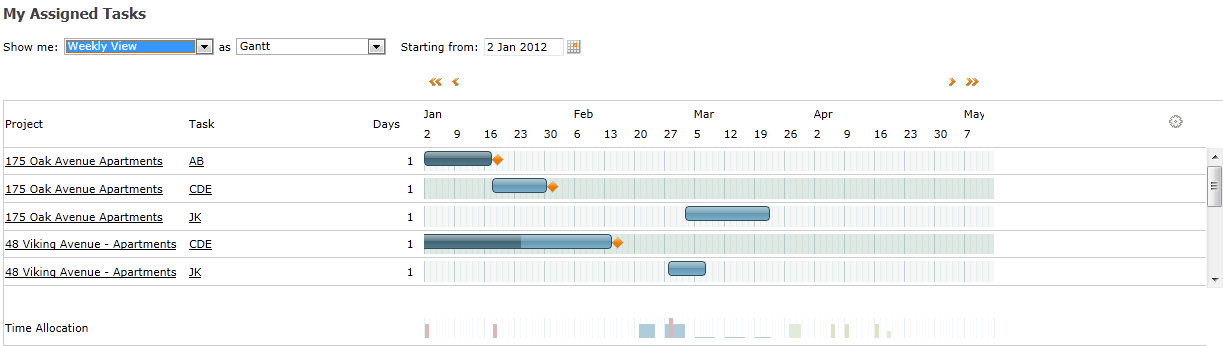
The My Assigned Tasks section shows the user all the tasks that they have been assigned to.
Select a Date to view your tasks from.
Select whether to view the Gantt view in hourly, daily, weekly or monthly view.
Choose Gantt or Histogram.
The Gantt bars run for the entire duration of the task and are coloured as follows:
Light Blue ~ Total length of task (from start date to end date)
Dark Blue ~ Work completed so far based on percentage complete
Red ~ Actual timesheet data logged exceeds forecast data so far
If you hover your mouse cursor over a Gantt bar or the number of days column it will show you the following information:
Task Name
Task Start and End Date
Planned Work ~ Number of days planned to work on the task and the total percentage completion of the task
Percentage of time allocated/Calendared Task ~ Percentage of time the user has been allocated to the task or advising the task is calendared.
Logged Hours ~ Total number of hours and the number of hours approved
Remaining Work ~ Total number of days and the number of hours
The Histogram view displays the percentage of your time allocated to each task, with the height of the histogram block representing the percentage of time (the higher the block, the greater percentage of time assigned).
If you hover your mouse cursor over a particular block on the timeline (the unit of time will depend on what View you have selected), your % resourced figure will be displayed.
Dark Blue - Resourced project time under 100% resourced
Red - Resourced project time over 100% resourced
Blue - Non working day (Usually Weekend)
Green - Regional non working time (Usually Bank Holiday)
Light Green - Approved absence request
This is a histogram view of the percentage of time that the user is resourced at for all tasks during the given period.
The height of the bar represents the amount of time resourced.
The higher the bar, the more time resourced.
Each type of activity is represented by a different colour.
Hovering your mouse cursor over the vertical bar will show the histogram detail in a text popup.
Translucent Dark Blue - Resourced project time under 100% resourced
Translucent Red - Resourced project time over 100% resourced
Translucent Blue - Non working day (Usually Weekend)
Translucent Green - Regional non working time (Usually Bank Holiday)
Translucent Light Green - Approved absence request
My Projects and Opportunities contains all open projects filtered by whether:
Any user can log time.
![]() Note: This
means the ‘Any User can assign time or expenses to this project’ box has
been ticked via Projects > Select
project > Project Summary.
Note: This
means the ‘Any User can assign time or expenses to this project’ box has
been ticked via Projects > Select
project > Project Summary.
They are assigned to the project team.
They are the client owner.
They are the project manager.
They are the project owner.
Once you have selected the desired set of projects, you can further filter the list using the filters along the top of the table.
For example, you can filter by Bid Status to only show projects in a certain Bid Status.

Was this topic useful? Click here to provide feedback.
Need further help? contact support.