Dashlets are added via Home > Dashboard > Configure Dashboard.
To add a dashlet
to your dashboard, simply click on the dashlet you would like to add.
It will be automatically added to your dashboard in the top left hand
corner.
Dashlets can be
placed as desired on your dashboard by dragging them into place
(hold left-hand mouse button over the dashlet title bar and drag as
desired).
You can add the same dashlet more than once.
This may be required if you want to track similar information but perhaps
against different departments, project owners, etc...
These settings can be made when you edit dashlets.
You can have a maximum of nine dashlets on screen at one time per user.
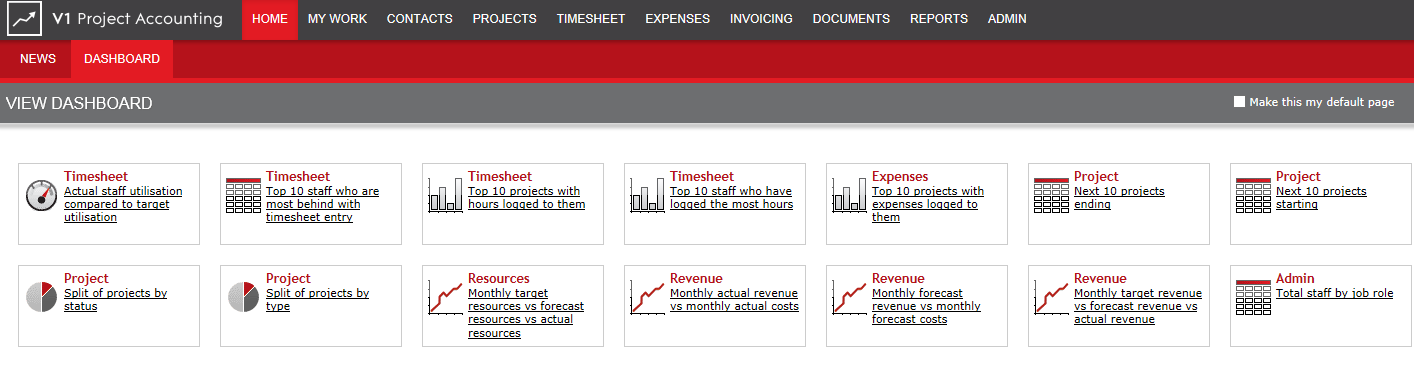
The following dashlets are available for selection.
All dashlets that include timesheet, expense and purchase invoice data
include data with approval status draft, submitted and approved.
![]() Note: Rejected data is not included.
Note: Rejected data is not included.
All dashlets utilise data polled on a nightly basis.
This means that in normal circumstances data entered on a morning will
not be included in a dashlet until the following day.
If you urgently require up-to-date reporting, an administrator within your company can refresh the reporting data so that it includes all data entered at that time.
This is completed via Admin > Company Settings > Reporting.
Title |
Group |
Description |
Type |
Notes |
Available Filters |
Staff Utilisation |
Timesheet |
Actual staff utilisation compared to target utilisation |
Gauge |
Excludes extra time logged and approved holidays to calculate utilisation. Actual figure goes green if >10% under utilisation, red if > 10% over utilisation. |
User Date |
Timesheet |
Top 10 staff who are most behind with the timesheet entry |
Tabular |
Shows staff behind to nearest day. |
User Date |
|
Top 10 Project Time |
Timesheet |
Top 10 projects with hours logged to them |
Bar Graph |
Bar is stacked core hours (blue) + extra hours (green). |
Project User Date |
Top 10 User Time |
Timesheet |
Top 10 staff who have logged the most hours |
Bar Graph |
Bar is stacked core hours (blue) + extra hours (green). |
Project User Date |
Top 10 Project Expenses |
Expenses |
Top 10 projects with expenses logged to them |
Bar Graph |
|
Project User Date |
Next 10 Projects Ending |
Project |
Next 10 projects ending |
Tabular |
Displays the next ten projects due to end. |
Project |
Next 10 Project Starting |
Project |
Next 10 projects starting |
Tabular |
Displays the next ten projects due to start from the current date. |
Project |
Projects by Status |
Project |
Split of projects by status |
Pie Chart |
Any statuses that are less than 5% of the total are grouped into a split titled 'Other'. |
Project |
Projects by Type |
Project |
Split of projects by type |
Pie Chart |
Any types that are less than 5% of the total are grouped into a split titled 'Other'. |
Project |
Resources vs Target |
Resources |
Monthly target resources vs forecast resources vs actual resources |
Line Graph |
Excludes extra time logged and holidays to calculate utilisation. Monthly figure includes all monthly data even if specific date selected. |
Project User Date |
Revenue vs Target |
Revenue |
Monthly department target revenue vs forecast revenue vs actual revenue |
Line Graph |
Forecast revenue is based on invoice rules (expense forecast and invoice schedule).
Actual revenue includes invoices with a status of sent, part-paid and paid.
Monthly figure includes all monthly data even if specific date selected. |
Project Date |
Actual Revenue vs Cost |
Revenue |
Monthly actual revenue vs monthly actual costs |
Line Graph |
Includes invoices with a status of sent, part-paid and paid.
The line values represent all Revenue/Cost against the filter selection and not between dates.
Does not include draft invoices. Cost is the sum of time and expenses.
Monthly figure includes all monthly data even if specific date selected. |
Project Date |
Forecast Revenue vs Cost |
Revenue |
Monthly forecast revenue vs monthly forecast costs |
Line Graph |
Forecast revenue is based on invoice rules. Cost is the sum of time and expenses.
Monthly figure includes all monthly data even if specific date selected. |
Project Date |
Staff Count by Job Role |
Admin |
Total staff by job role |
Tabular |
A maximum of 24 job roles can be displayed in this dashlet.
If you have more than 24 job roles you can use the User filters to select job roles you are specifically interested in tracking. |
User |

Was this topic useful? Click here to provide feedback.
Need further help? contact support.